Voitto+
CD ROM
Graphic comparison
On the graphic comparison screen you can compare the development of the financial standing of the company to other companies or lines of business with the help of graphic presentations.
In the upper part of the graphics screen you can find the basics of the company, from the financial statements or ratio data of which you have entered the screen.
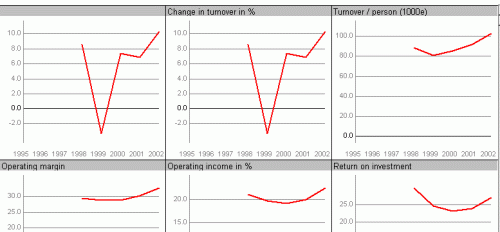
The ratio graphics enables you to compare the development of the company’s ratios to other companies or lines of business you have selected.
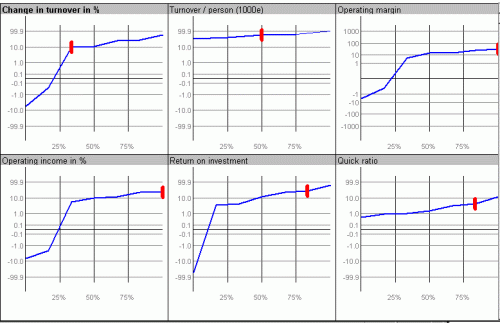
Using the graphic distribution, you can examine the placing of the company’s ratios in relation to all companies operating in the same line of business.
![]() button takes you back to the financial
statements data of the company.
button takes you back to the financial
statements data of the company.
![]() button takes you to
the ratio screen to examine the company’s ratios in the form of
a table
button takes you to
the ratio screen to examine the company’s ratios in the form of
a table
![]() Including companies
and lines of business in the comparison
Including companies
and lines of business in the comparison
![]() Ratio graphics
Ratio graphics
![]() Graphic distribution
Graphic distribution
![]() Printing of
graphics
Printing of
graphics
INSERT button enables you to include the company on the screen in the comparison.
![]()
You can change the company under comparison to another in the company list by using the arrow keys in the company browsing.

You
include other companies in the search with the Insert button. This button
opens the company list, from which you can select companies by clicking
the company’s name.
Also lines of business are included in the comparison by using the Insert
button. The button opens the list of all lines of business, from which
the selection is made by clicking the name of the line of business.
You can select at most 7 companies and lines of business to the graphic presentation of ratios.
If you wish to remove companies or lines of business from the comparison, first click the name of the subject on the screen and then the Delete button.
The graphic distribution is formed from the ratios of the reference company and those of companies operating in the same line of business.
After
you have selected the companies and lines of business to the ratio comparison,
select the ratio graphics from the lower part of the screen and click
the button Ratio graphics.
![]()
The program draws thirteen graphic presentations in all from the ratios of selected companies or lines of business, from up to five financial years (change in turnover in %, turnover/person, operating margin in %, operating profit in %, return on investment in %, quick ratio, current ratios, equity ratio).
You get more pictures to the screen by utilising the lift function of the screen. You can also fix the desired picture by clicking the screen, in which case scrolling the page does not affect this picture.
The
screen in the upper left-hand part indicates the number of companies and
lines of business in the comparison. NOTE! Ratios
have not been calculated of all companies, even if the financial statements
are available in the database of Voitto.

The Distributions button enables you to examine the placing of the ratios of the reference company in relation to other companies operating in the same line of business.
Select
the reference company using the ![]() button.
button.
Select the graphic distribution from the menu in the lower part of the
screen and click the button Ratio graphics.
![]()
The graphic distribution shows the ratios of the reference company in relation to the ratios of other companies operating in the same line of business. The distributions are shown from the year you have selected as search criterion on the Search criteria screen.

You
can print the graphic presentations using the ![]() button of the graphic screens either
black and white or coloured, depending on the printer in use.
button of the graphic screens either
black and white or coloured, depending on the printer in use.
Printing the graphics does not use the printing rights in Voitto.